How to Estimate Short Term Rental Revenue in 2026 (5 Steps)
Nightly rate times occupancy times 365 is the easy part. Occupancy is where estimates go wrong, because it is read off forward booking calendars that run low by design. The five steps, why free calculators disagree, and what a trustworthy estimate shows you.
By Chirag Jakhariya, Co-founder & CEO · · 11 min read
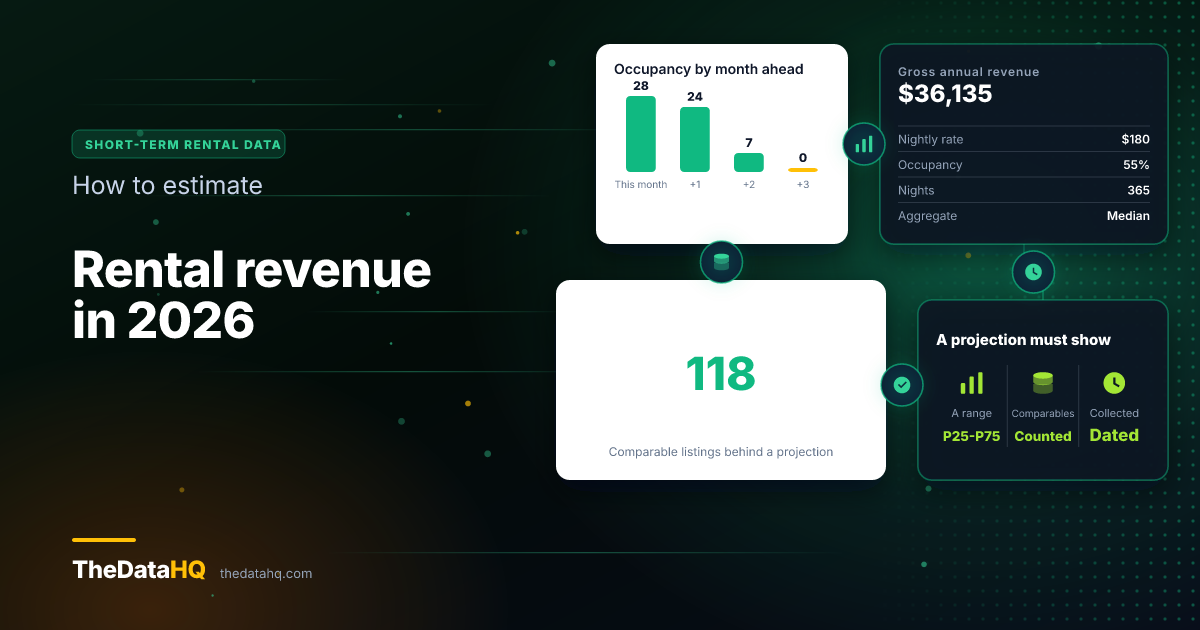
Short-term rental revenue is nightly rate times occupancy times 365. A three-bedroom renting at $180 a night, booked 55% of the time, comes to roughly $36,000 a year before you take a single cost off it. The arithmetic is the easy part. Occupancy is where estimates go wrong, and most free calculators read it off forward booking calendars, which run low by design. Here are the five steps, and how to tell a careful estimate from a confident one.
If you only read that paragraph, take this with you: treat any single annual figure as the middle of a range, and ask what it was built from.
What Is Short Term Rental Revenue?
It's the gross rent a property collects from guests over a year. Not profit. Not what lands in your account. Just the money guests pay for nights.
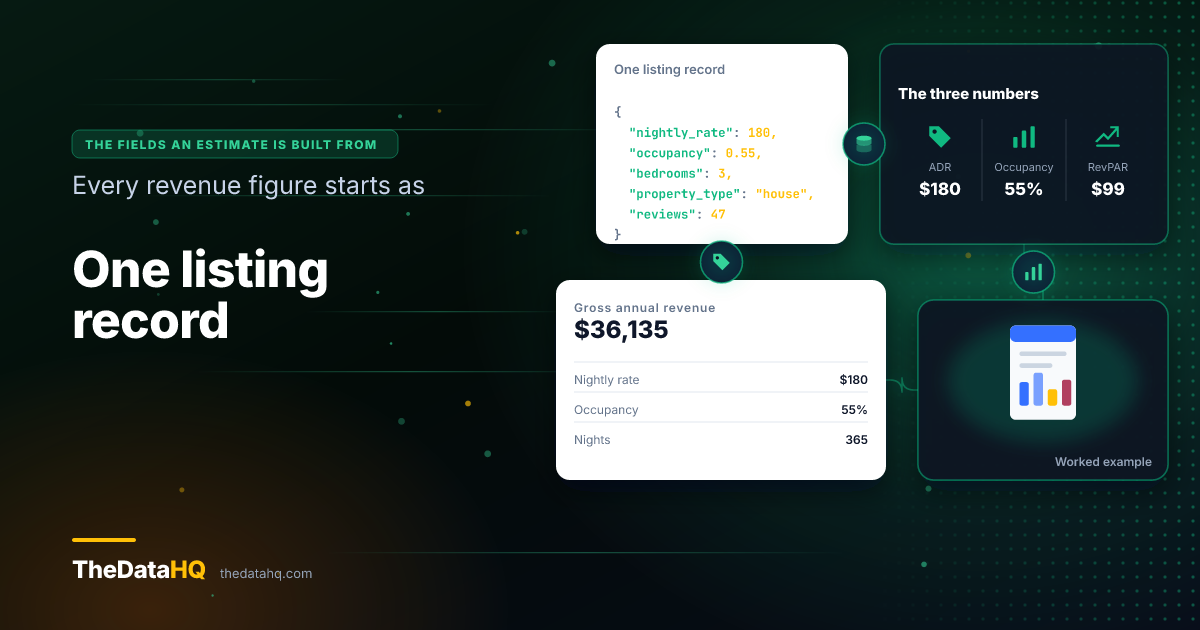
Three numbers sit underneath it, and every tool in this market reports them. They're worth knowing by name, because that's how you'll compare one estimate against another.
What does ADR mean?
ADR is average daily rate, which is what a property charges per night once you average across the year. It's the headline price, not the total a guest pays: cleaning fees, service fees and taxes sit outside it.
That distinction matters more than it sounds. A listing advertised at "$420 for 3 nights" is not a $140 ADR if $105 of that is a cleaning fee.
What is occupancy in a short-term rental?
Occupancy is the share of available nights that get booked. A property booked 200 nights out of 365 runs at 55%.
Nobody outside the platform sees booked nights directly. What's visible is the opposite: which dates a listing still has free. So occupancy gets inferred from unavailability, and that inference carries a bias we'll come back to, because it's the single biggest reason two calculators hand you different answers for the same house.
What is RevPAR, and why do investors use it?
RevPAR is revenue per available rental, which is ADR multiplied by occupancy. It's one number per night of ownership, whether or not anyone stayed.
It exists because rate and occupancy trade against each other. A property can raise its price and lose nights, or cut its price and fill up, and look better on one measure while going backwards. RevPAR catches both at once, which is why it's the right column to sort a market by.
How Do You Calculate Short Term Rental Income?
Gross revenue is one line:
- ADR × occupancy × 365 = gross annual revenue
- $180 × 0.55 × 365 = $36,135
That figure is what almost every calculator shows you, and it's the number people quote to each other. It is also not income in any sense your accountant would accept.
What does the formula leave out?
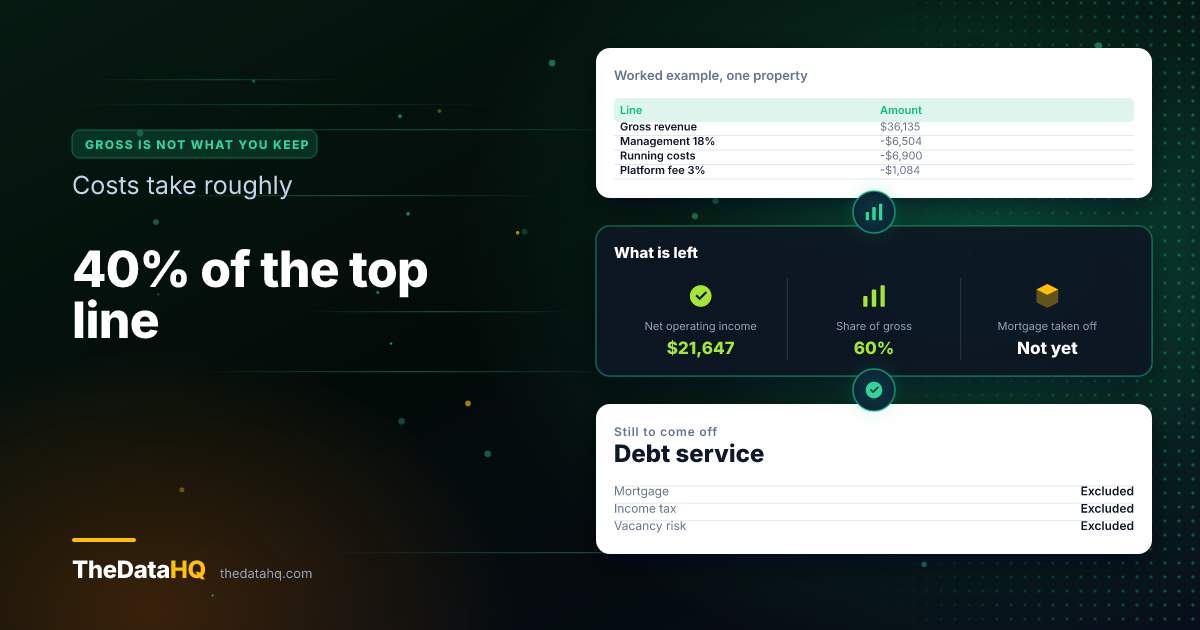
Everything between the guest paying and you keeping it. On a managed property that's commonly 30% to 50% of the gross, and it's consistent in what it consists of:
- Platform fee — charged to the host on every booking
- Cleaning — usually charged to the guest and paid straight out, so it passes through rather than adding up
- Management — 15% to 25% of revenue if someone else runs it
- Utilities, internet, consumables — higher per night than a long-term let, because the guest has no reason to economise
- Maintenance and turnover damage — a nightly let ages faster than an annual one
- Insurance, licensing, local lodging tax — the part that varies hardest by city
- Debt service — the mortgage, which no revenue calculator knows about
A revenue estimate that doesn't subtract these isn't wrong. It's just answering a different question from the one you're asking.
How to Estimate Short Term Rental Revenue in 5 Steps
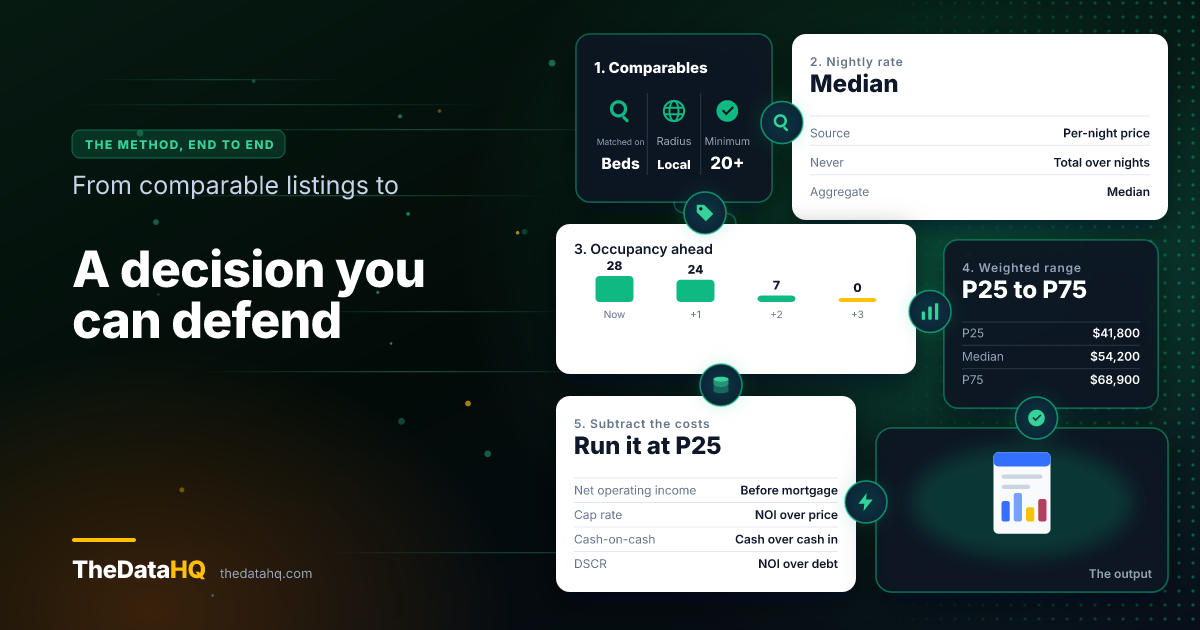
This is the method a property appraiser would recognise, applied to nightly rentals. It works whether you do it by hand for one house or build something that does it for a whole city.
How do you pick the right comparables?
A comparable is a listing close enough to yours that its performance tells you something about yours. Get this wrong and nothing downstream recovers.
Match on the things guests actually choose between:
- Bedrooms first. It dominates everything else. A two-bed and a four-bed in the same street are different businesses.
- Distance. Same neighbourhood, not same city. A mile can halve a nightly rate.
- Property type. A whole house, a flat and a private room don't compete for the same booking.
- Capacity. Sleeps 6 and sleeps 10 are priced differently even at the same bedroom count.
- Established listings only. A listing with two reviews hasn't found its price yet.
Twenty well-matched comparables beat two hundred loose ones. If you can't find twenty, that's information: it means the market is thin, and your estimate should say so rather than quietly widening its net.
How do you get the nightly rate right?
Take the per-night price the platform itself publishes, not a total divided by nights.
Multi-night totals bundle fees. Divide "$420 for 3 nights" by three and you've quietly folded a one-off cleaning charge into an ongoing rate, which then gets multiplied by 365. A $105 cleaning fee spread this way inflates an annual estimate by about $12,000.
Then use the median, not the average. Rental prices have a long tail at the top, and one $3,000-a-night property will drag a neighbourhood average somewhere no real house sits. The median just takes the middle listing and ignores how extreme the extremes are.
How do you estimate occupancy and vacancy?
This is the step that decides whether your estimate is any good.
The standard approach reads each listing's forward availability calendar and treats an unavailable night as a booked night. It's the best proxy available from public information, and it is a proxy, not a measurement.
Two things push it in opposite directions:
- It runs low because a calendar shows what's been booked so far, and dates further out simply haven't sold yet
- It runs high because hosts block dates for maintenance, personal use, or awkward gaps between minimum stays, and a blocked night looks identical to a booked one
These don't cancel out, and no honest tool pretends they do. What a good one does is keep the window short. A 30-day forward window is the closest thing to the truth on offer, because the nearest month is the one that's most fully sold.
How do you turn comparables into a range?
Don't average them. Weight them, then report the spread.
Weighting means a comparable two doors down with the same bedroom count counts for more than one across town with an extra bathroom. Once weighted, report three figures rather than one:
- P25 — a quarter of comparable listings earn less than this. Your conservative case
- Median — the middle. Your working number
- P75 — a quarter earn more. Achievable, not promised
A range is not a hedge. It's the actual finding. The spread between P25 and P75 tells you how much the market agrees with itself, and a wide spread is a warning that a single number would have hidden.
How do you subtract the costs?
Now the estimate becomes a decision. Run the range through the deal, not just the top line:
- Net operating income — gross revenue minus running costs, before the mortgage
- Cap rate — net operating income divided by purchase price, which is how you compare this property against a different one
- Cash-on-cash — annual cash left over divided by the cash you actually put in
- DSCR — debt service coverage ratio, which is net income divided by the mortgage payment. Under 1.0 means the property doesn't pay for itself, and it's the number a lender asks for first
- Break-even revenue — the gross figure at which you stop losing money
Run all of them at P25, not at the median. If the deal only works at the optimistic end, it isn't a deal, it's a hope.
Why Do Airbnb Revenue Calculators Disagree?
Put the same address into three free calculators and you'll get three answers, sometimes far apart. They're not all broken. They're making different choices at step three, and none of them shows you the choice.
Where does calendar occupancy go wrong?
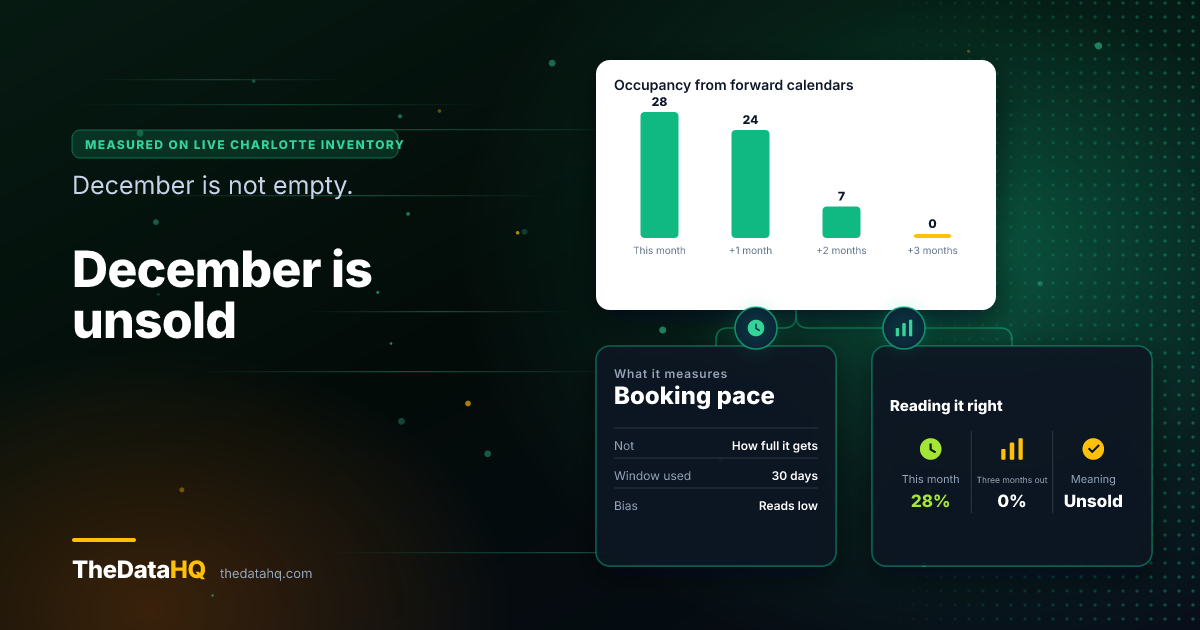
Here's the effect measured rather than asserted. StayScope, an open-source rental market project we built and published, read forward calendars across live Charlotte inventory and grouped the result by how far ahead it looked:
| Months ahead | Median occupancy |
|---|---|
| This month | ~28% |
| +1 month | ~24% |
| +2 months | ~7% |
| +3 months | ~0% |
December is not empty. December is unsold. What that table measures is how fast people book, not how busy a property gets, and any tool reading a 90-day window is averaging the two together and calling the result occupancy.
So a calculator using a long forward window will understate revenue, and one using a short window will be closer but still low. Neither is lying to you. One of them is just further from the question.
What else moves the number?
Four choices, all invisible in the output:
- Median or average. One luxury property can move an average a long way and a median not at all
- Which listings got excluded. Brand-new listings, impossible prices and data errors have to go somewhere, and tools differ on where
- Whether cleaning fees are in the rate. Covered above, and worth about $12,000 a year on a single mistake
- How far the comparables reach. A tool short of local matches will widen its radius rather than admit the market is thin
Should you trust a single figure?
No, and the reason isn't that the figure is wrong. It's that a single figure can't tell you how confident it is.
"$54,200 a year" and "$54,200 a year, from 11 comparable listings that disagree with each other by a factor of two" are the same estimate. Only one of them is usable.
What Does a Trustworthy Revenue Estimate Look Like?
It shows its working. That's the whole test, and it's easy to apply to any tool in about a minute.
What should a projection tell you?
Five things, and you should be able to find all five without contacting anyone:
- A range, not a point. P25 to P75 at minimum
- How many comparables it used, as a count
- A confidence grade that explains itself. "Low confidence: only 11 comps, and they disagree by a factor of two" is actionable. "Medium confidence" alone is decoration
- When the data was collected. A rate from last season is a different claim from a rate from last week
- What it excluded, counted. Not hidden, and not silently dropped
A tool that gives you a range with a count and a date is being straight with you. One that gives you a clean annual figure and a call-to-action is selling something.
How many comparables is enough?
There's no threshold that makes an estimate true, but there are rough bands worth holding in your head:
- Under 20 — treat the number as a direction, not a figure
- 20 to 50 — usable if the spread is tight and the matches are close
- Over 100 — the sample is no longer your limiting factor. Bias in the occupancy proxy is
That last point catches people out. Past a certain sample size, collecting more listings stops helping, because what's wrong with the estimate isn't noise. It's the method.

What Data Do You Need to Estimate Revenue?
Less than people expect, but it has to be current and it has to cover the whole market rather than a sample of whatever was easy to collect.
| Field | Why it's needed |
|---|---|
| Nightly rate | Half the revenue formula |
| Forward availability | The only public route to occupancy |
| Bedrooms and capacity | The main thing comparables match on |
| Coordinates | Distance, which beats postcode |
| Property type | Separates competing inventory from the rest |
| Amenities | Price premiums, once controlled for size |
| Review count | Filters listings that haven't established a price |
| Collection date | Turns one snapshot into a trend |
That last row is the one people skip. A single collection tells you what a market looks like. Repeated collection tells you where it's going, and the second is worth considerably more than the first. Turning those records into something a person can decide on is a separate job again, and it's the one we call data intelligence.
Can You Build a Rental Revenue Estimator Yourself?
Yes, and it's a reasonable weekend-scale project if you can write Python. We published one as an open-source project, StayScope, partly to show what the work involves rather than describe it.
It collects listings across 32 bundled markets, stores them so that repeated runs build a history, and produces a P25 to P75 revenue range with a confidence grade and a full deal analysis underneath it. It also runs offline against a built-in data generator, so you can see the whole thing work without collecting anything at all.
What does a collection run involve?
Three passes, cheapest first, because the expensive requests should only be spent where they buy something:
- Search — about one request per 18 listings. Returns the listing, where it is, its rating and its nightly rate
- Detail — one request per listing, on a sample. Bedrooms, capacity, property type, amenities
- Calendar — one request per listing, on a sample. Forward availability, which is where occupancy comes from
The pace is deliberate: roughly one request every 1.5 seconds, with a little randomness so it doesn't arrive like a metronome. A few hundred listings therefore takes several minutes rather than seconds. That's the ceiling on every job of this kind, and it's why a city-scale collection is measured in hours and a country-scale one in days.
When should you buy the data instead of collecting it?
Building it once is straightforward. Keeping it running is the part that costs, and the honest split looks like this:
- Build it yourself if you're analysing a handful of markets, you can absorb a broken week, and the learning is part of the point
- Buy a feed if a number is going in front of a customer, a lender or an investment committee, where stale data is worse than no data
Public pages change their structure without warning, and a collector built against last month's layout returns empty fields rather than an error. We wrote about that failure in more detail in our guide to scraping dynamic websites, and about the wider choice in running the scraper versus buying the feed. If you'd rather not own that maintenance, real-time data collection is what we do, and what a collection project costs is published rather than quoted on request.
Is It Legal to Collect Short Term Rental Data?
Generally yes for public, non-personal listing information, with real conditions attached. This is general information and not legal advice, and the position differs by country.
What does robots.txt allow?
robots.txt is a file a website publishes saying which parts of it automated visitors may read. It's the first thing to check and the easiest to respect.
Checking it live before each run, rather than reading it once and assuming, is the difference between a system that stays inside the rules and one that used to. If a rule changes, the right behaviour is to stop with a clear error, not to work around it.
What about a platform's terms of service?
They're a separate obligation, and they bind you whether or not a page is public. A permissive robots.txt is not permission under a contract.
Three lines worth holding to, and all three are engineering decisions as much as legal ones:
- Public and non-personal only. Listing attributes, prices and availability. Not guest data, not host contact details
- A real pace, and a real identity. Requests spaced out on purpose, and an honest label saying who is asking, with a contact address
- For anything commercial, prefer a licensed feed or an official partner programme. Build the system so swapping the source is one change, not a rewrite
The market itself is not small, which is why licensed options exist at all. Airbnb reported gross booking value of $27.2 billion in the second quarter of 2026, up 16% year on year, with nights and seats booked up 10%.
Questions People Ask About Short Term Rental Revenue
What is short term rental income?
It's the money a property earns from guests staying for short periods, usually under 30 nights. Gross rental income is nightly rate times nights booked. Net income is what's left after platform fees, cleaning, management, utilities, maintenance, insurance, local taxes and the mortgage. Most calculators report the gross figure, which is commonly 30% to 50% higher than what you keep.
How do you calculate short term rental income?
Multiply average nightly rate by occupancy by 365. At $180 a night and 55% occupancy that's $36,135 gross a year. Then subtract running costs to get net operating income, and subtract the mortgage to get cash flow. Use the median nightly rate of comparable listings rather than the average, because one expensive property distorts an average badly.
How much can you make on Airbnb?
It depends almost entirely on location and bedroom count, so any national figure is close to meaningless. The useful version of this question is answered with local comparables: find twenty or more established listings matching yours on bedrooms, type and neighbourhood, and read their range. Expect a spread, and plan against the lower quarter of it rather than the middle.
Is Airbnb a short term rental?
Airbnb is a booking platform; a short-term rental is the property type it mostly lists. The distinction matters for regulation. Local rules apply to the letting of a property for short periods regardless of which platform it appears on, so a city's registration requirement or night cap follows the property, not the website.
Can you use short term rental income to qualify for a mortgage?
Sometimes, and lenders are stricter about it than about long-term rent. They generally want documented history rather than a projection, and both Fannie Mae and Freddie Mac publish guidelines covering how short-term rental income may be counted. A calculator estimate is not evidence. Check with the specific lender before assuming a projection will support borrowing.
Are free Airbnb revenue calculators accurate?
They're useful for a first pass and unreliable for a decision. The main weakness is occupancy, which is inferred from forward availability calendars and runs low the further ahead it looks. Check whether a tool tells you its comparable count, its collection date and a range rather than one figure. If it shows none of those, treat the output as a direction.
What is a good occupancy rate for a short term rental?
There's no universal target, because rate and occupancy trade against each other: a property at 45% occupancy and a high nightly rate can out-earn one at 70% and a low one. Compare on RevPAR, which is rate times occupancy, rather than on occupancy alone. Against local comparables is the only comparison that means much.
Where can you get short term rental data?
Three routes. Paid market platforms sell processed estimates per market. Some cities publish registration data openly, which is good for supply and useless for rates. Or collect public listing data yourself, which gives you the fields you actually want and hands you the maintenance. Which one fits depends on whether the number faces a customer or just you.